Kids’ Health,
Understood.
Where parents find and share the nitty-gritty answers for kids’ health and development.
Why choose Sleuth?
- 1
Track the ups and downs of your child’s journey
- 2
Discuss & share observations with other parents
- 3
Discover benchmarks for your biggest concerns
- 4
Get results from 62,000 parents’ reports
- 5
Start anytime from birth to 17 years old
Let Sleuth guide you
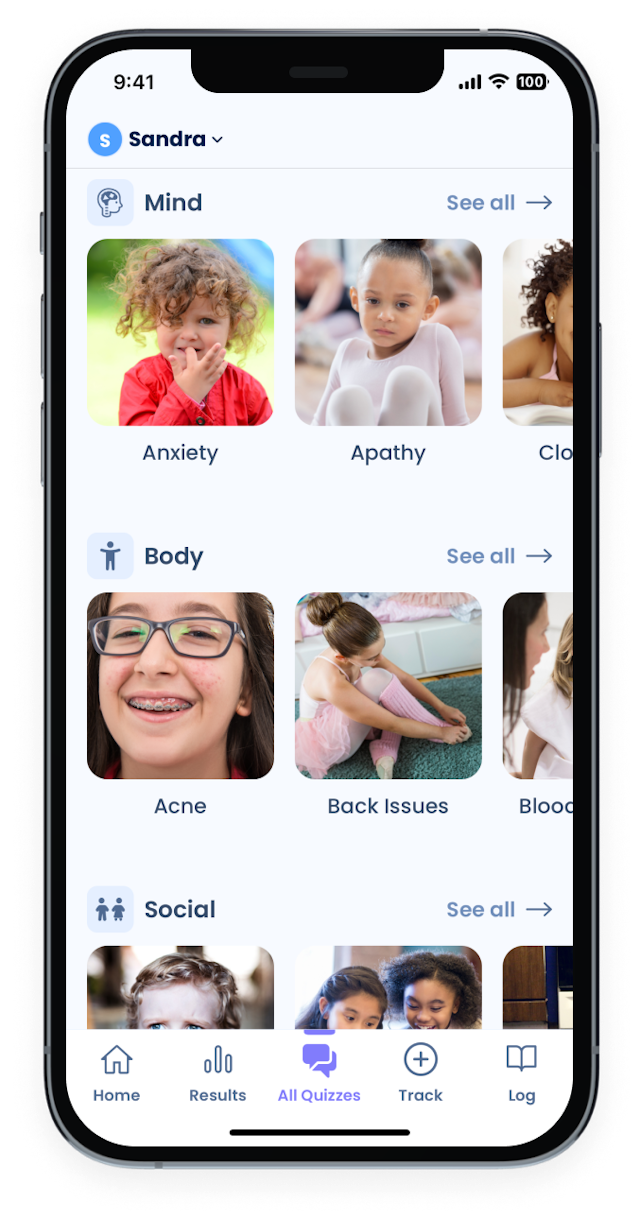
From eye contact to teenage rebellion, and headaches to energy levels
See your child’s mind, body, and social progress
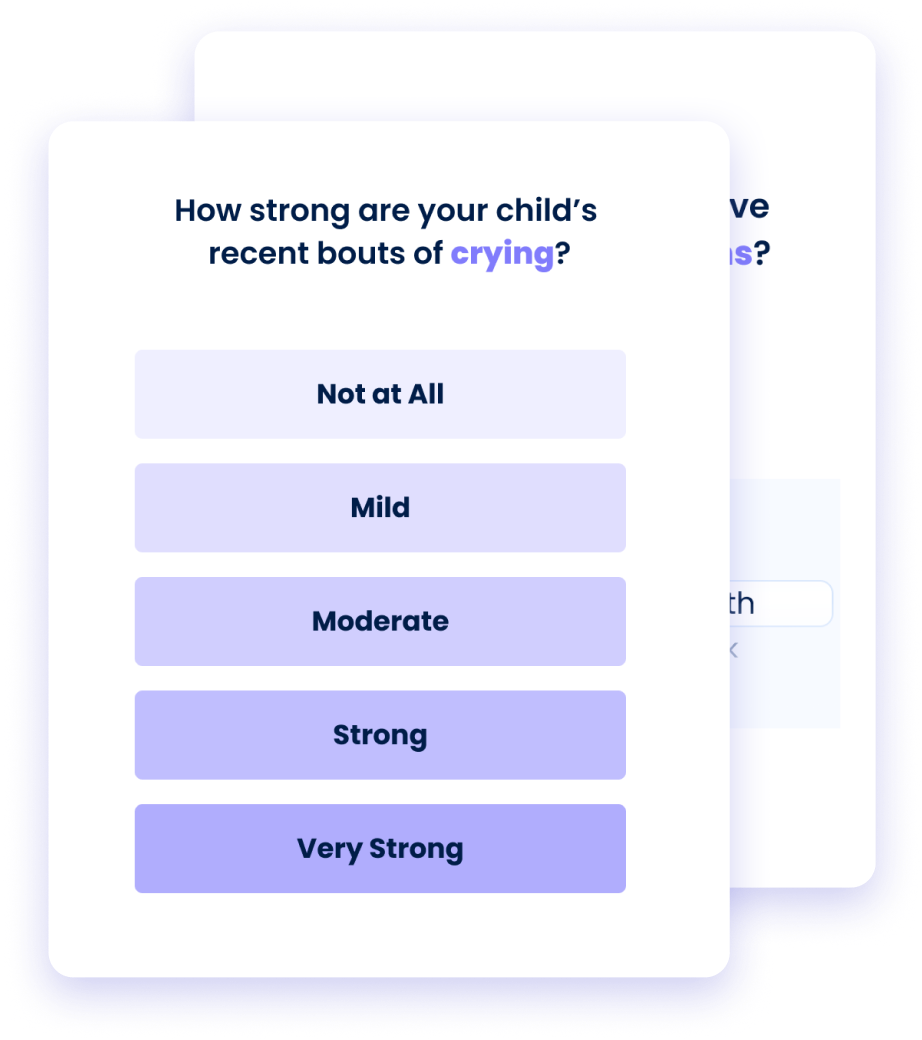
Answer one-minute quizzes on 285 topics: tantrums, sleep, eating, speech, colds + more
Find more than 1,000 pages of doctor-reviewed advice
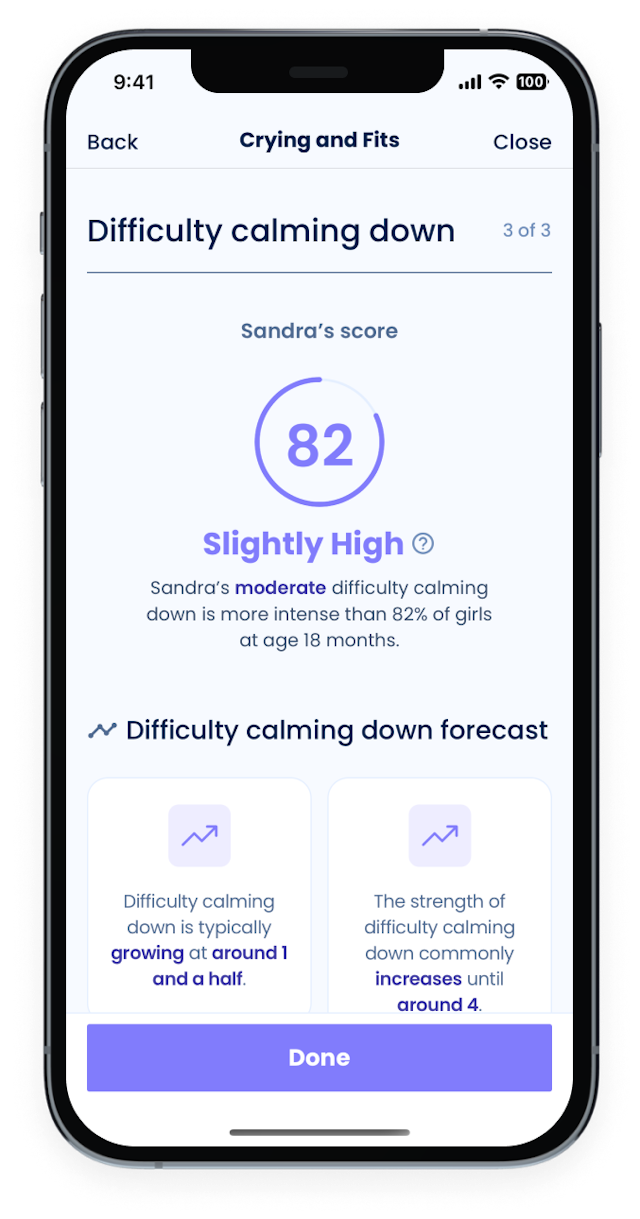
Get clear answers
Discover your child’s scores on every topic
Explore forecasts about what to expect
Read discussions and contribute anonymously
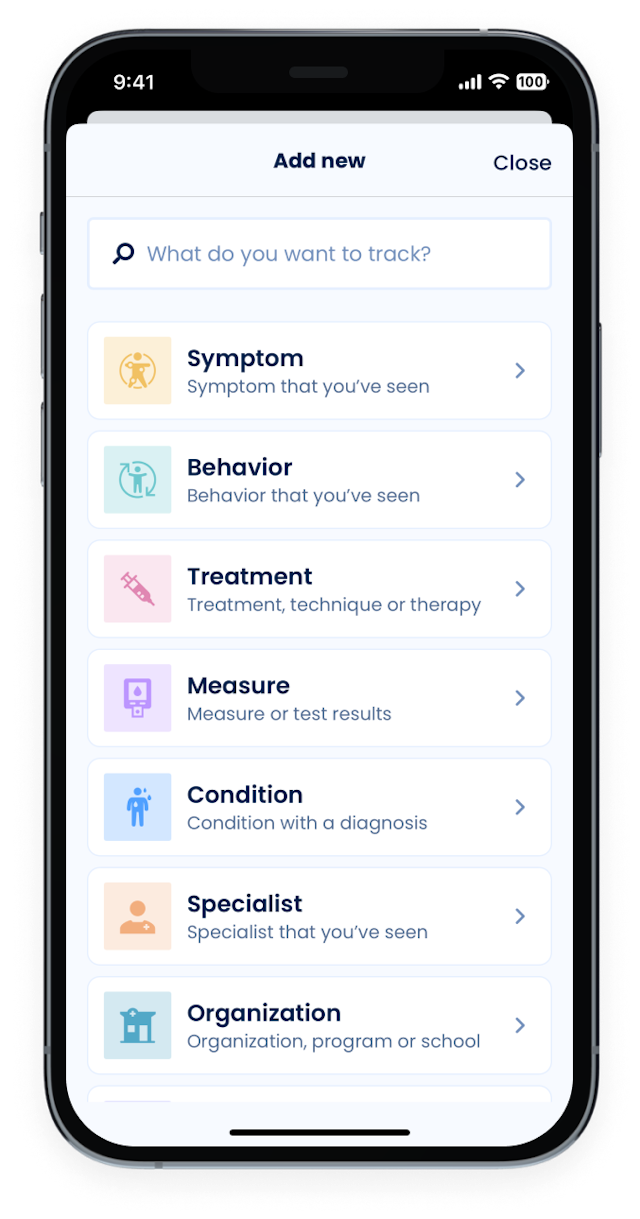
Track anything for your child
Log any symptom, behavior, treatment, and program
No event is too small. Attach notes, photos, videos, and timing.
Record your child’s growth and milestones
Capture every new word, growth, & progress.
You control your privacy.
Your account is hidden unless you choose to share anonymous data.
What parents who use the Sleuth App say


Join the Club
Subscribe to the Sleuth weekly newsletter and receive special access to Sleuth news, data insights, and product releases.
100% Free. No spam.
Parent-contributed, physician-advised
30,000 ideas for kid’s care and treatment
50k+ parents and growing
Sleuth’s Mission
Sleuth’s mission is to be the first place every parent goes for non-emergency concerns about children’s health and development.
We use information that only parents and caretakers can provide. Parents are the glue who connect schools, doctors, therapists, and local kids’ programs. Parents, families, and caretakers are the ones who provide day-to-day child care. The value of this highly specialized experience, multiplied across tens of millions of parents, is our guiding light.
Sleuth uses Artificial Intelligence to create the world’s most advanced map of parents’ written text. We’re just starting, but the more information parents volunteer to share, the better our system gets.
By 2024, our goal is to have contributions from over 100,000 parents. Download Sleuth’s app and select “Join In (Share Anonymously)” during sign-up to build Sleuth with us.